Report Builder 2.0 is basically used for Designing the Reports which we incorporate in applications using SSRS [SQL Server Reporting Services], You do have one separate template to design and develop Reports using a commonly known tool “SQL Server Business Intelligence Development Studio”. Report Builder 2.0 is independent tool for designing the reports which you can download from :
After installation, you can Run Report Builder 2.0 from Start-> All Programs –> Microsoft SQL Server 2008 Report Builder 2.0
You will then get following Console :
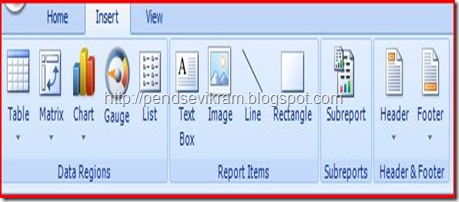
If you observe carefully, Top menu is now got replaced by “Ribbon” [ Refer Top Menu in any MS Office 2007 Application ] which adds ease for finding functionality smoothly and fast since they are categorized.
Left side panel usually contains your Built-in Fields which are provided by default by Report Viewer 2.0, that contains fields like Page numbers, DateTime, Report URL and name and much more.
Middle panel is layout window where you actually place the things like table/matrix/graphs/gauges etc and design report.
Right side panel usually contains properties of respective elements which we have on layout.
If you see the above picture carefully, You will find that now SSRS Report Builder 2.0 enables you to put on Graphs and Gauges on your Report [ Hope you aware of .NET Dundas Control, Now they are here ] , I personally have not seen such wonderful facility of graphs and gauges in crystal reports, even such rich GUI to design reports is not given for the same in Crystal Reports,well I think its totally user choice what to go for.
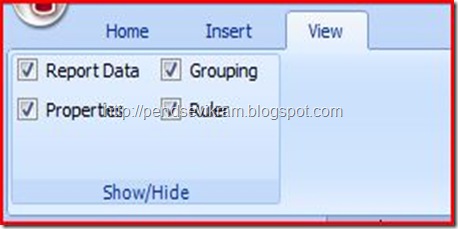
Inside View Menu you can set and reset Ruler for layout and other windows like Properties and Grouping.
Also do observe on bottom side, same like in MS Office applications, you can now Zoom your layout to a great extend with the zoom scroll given at the bottom side, Also similar to run slides option in PowerPoint at bottom side, now you have Run report option at bottom. This is basically quick way to run reports.
Once you design and develop report, you need to upload the corresponding report files to Report Server Directory on Report Server. For those who are new one, here I am showing you how that window looks like where you can configure your Reporting Server settings. You will find that at Start-> All Programs-> Microsoft SQL Server 2008->Configuration Tools-> Reporting Services Configuration
I hope this will give you overall idea about what is new in Report Builder 2.0, I am not stopping here with this post, I will soon share with you all , how we can actually design report, That I am planning to do with real case base scenario soon which will talk about parameterized reports and graphs also with some Report UI tips and tricks etc.
Vikram.


2 comments:
Its Great ...Keep..it up...I am waiting for next one...
Thanks S Singh,hope you find it useful to star with the tool.
Post a Comment